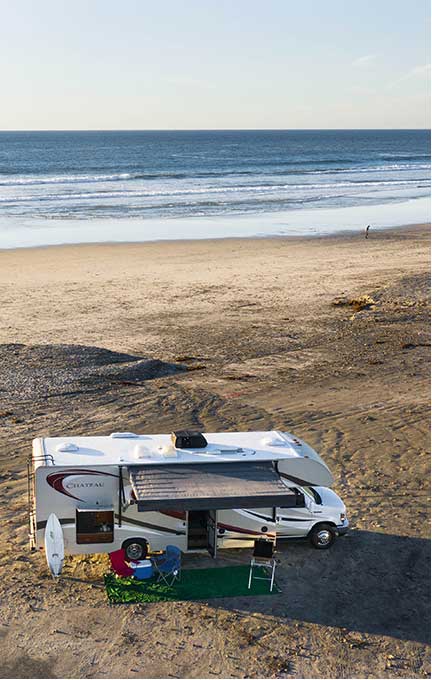


Unlike other segments of the travel and tourism economy, the market for recreational vehicles has been thriving in the face of COVID-19. Compared to other travel options like flying or staying in a hotel, traveling by RV makes it easier to maintain physical distance and lower the risk of exposure to coronavirus. Early indications are that the appeal of RVs has continued to grow during the pandemic, and industry experts are anticipating a nearly 25% surge in RV shipments in 2021.
But the increased demand for RVs is not surprising, as the market has been growing consistently over the last decade. For example, according to a recent Census Bureau report, RV dealership sales increased by more than 81% between 2012 and 2017, the most recent year for which Census data is available. The market has been driven by an aging population, as more Baby Boomers hit the road in retirement, but also by strong interest among Millennials and Gen Z consumers interested in camping and outdoor experiences.
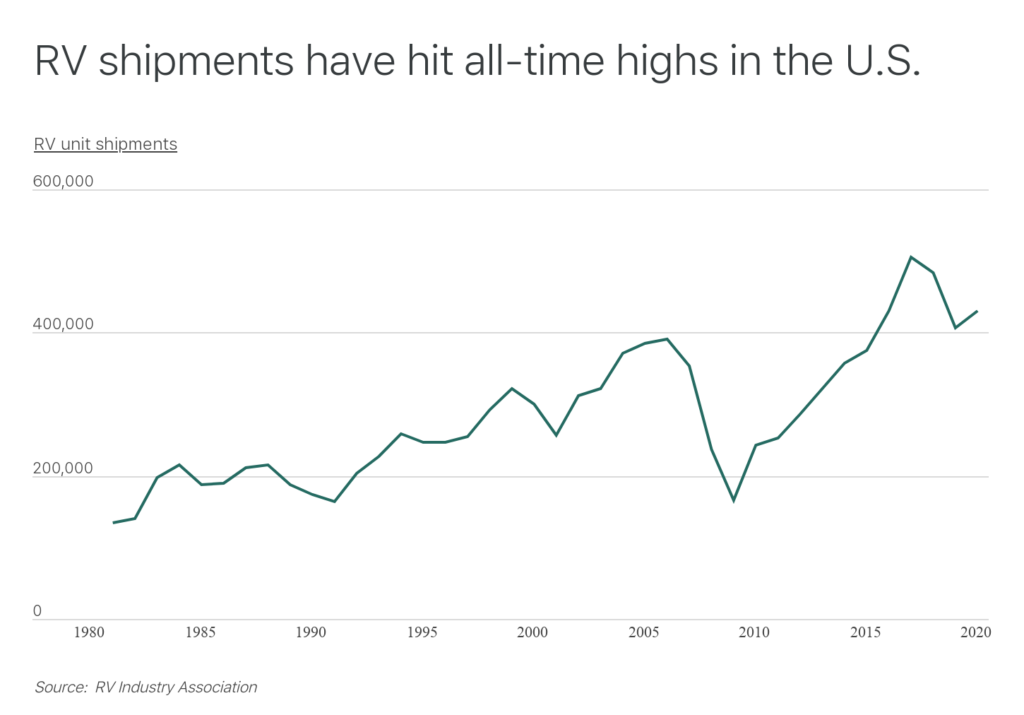
RV shipments also demonstrate the longer-term increase in demand. Data from the RV Industry Association shows that shipments of RVs have reached all-time highs in recent years. From 1981 to 2020, the number of RVs shipped rose from around 133,000 to 430,000. Remarkably, much of this growth has occurred just since the last recession in 2009. That year, shipment numbers dropped to their lowest levels since 1991 at around 165,000. Between that point and 2020, shipments increased by approximately 160%.
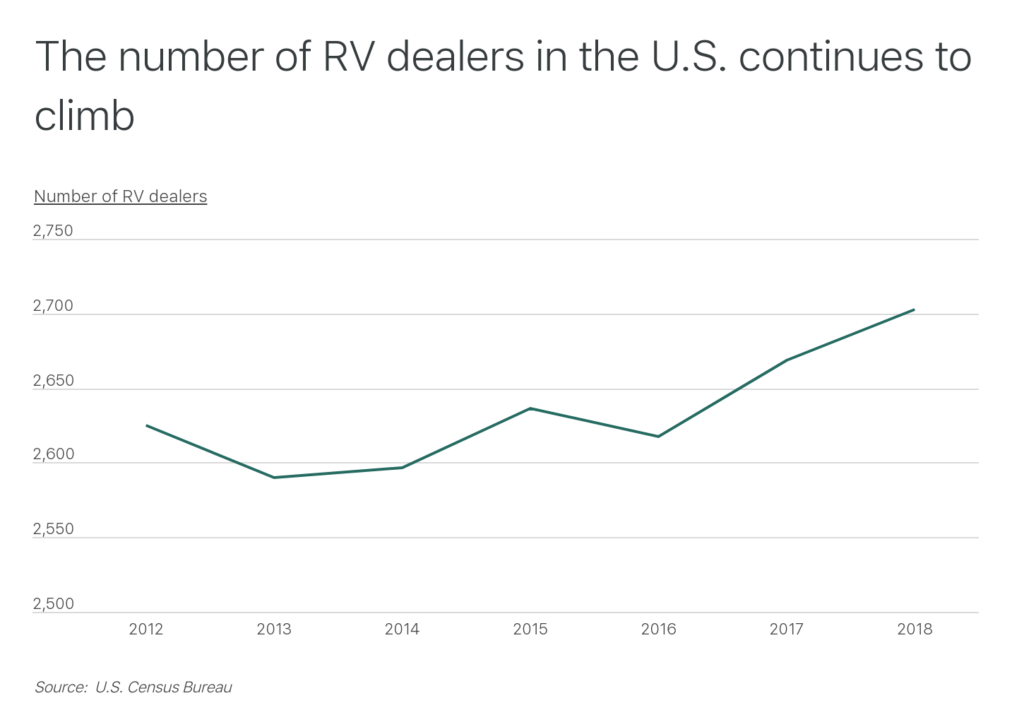
This increase in demand has also presented an opportunity for dealers to get into the RV business. As shipments have grown, the number of dealers has also seen a steady increase over the past decade, according to Census Bureau data. In 2012, the industry had 2,625 U.S. dealers; that number grew to 2,703 in 2018.
RELATED
Use Outdoorsy for up-to-date, detailed guides on all of America’s national parks, like Rocky Mountain National Park and Grand Canyon National Park.
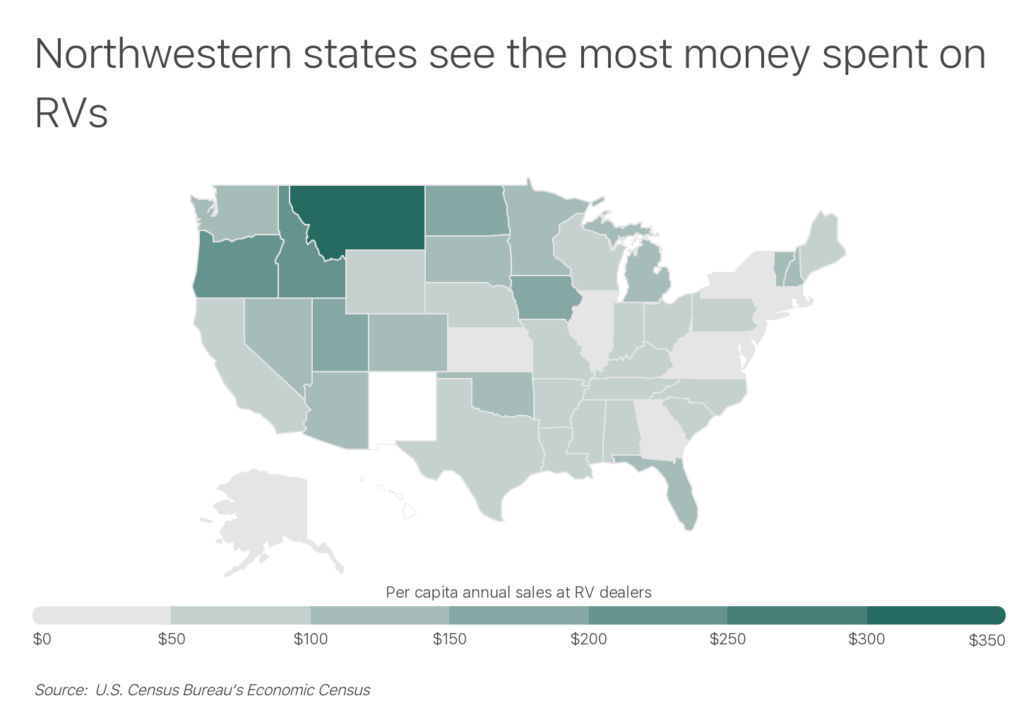
The interest in RVs looks different across geographic areas, with many of the states that see the most money spent on RVs being located in the northwestern United States. Part of the reason for this may be that these locations are also frequent destinations for RV travelers seeking out natural attractions. Residents and travelers in the Northwest have no shortage of state and national parks, protected lands, and other scenery to experience while on the road.
But one state stands out above the rest: Montana, which generates an average of more than $300 in annual RV sales per person. While Montana appeals to RV travelers with destinations like Yellowstone and Glacier National Park, one of the main reasons why Montana leads the nation in sales per capita is its favorable policies for RV buyers. The state has no sales tax, offers low registration fees, and allows non-residents to set up LLCs in the state to facilitate RV purchases.
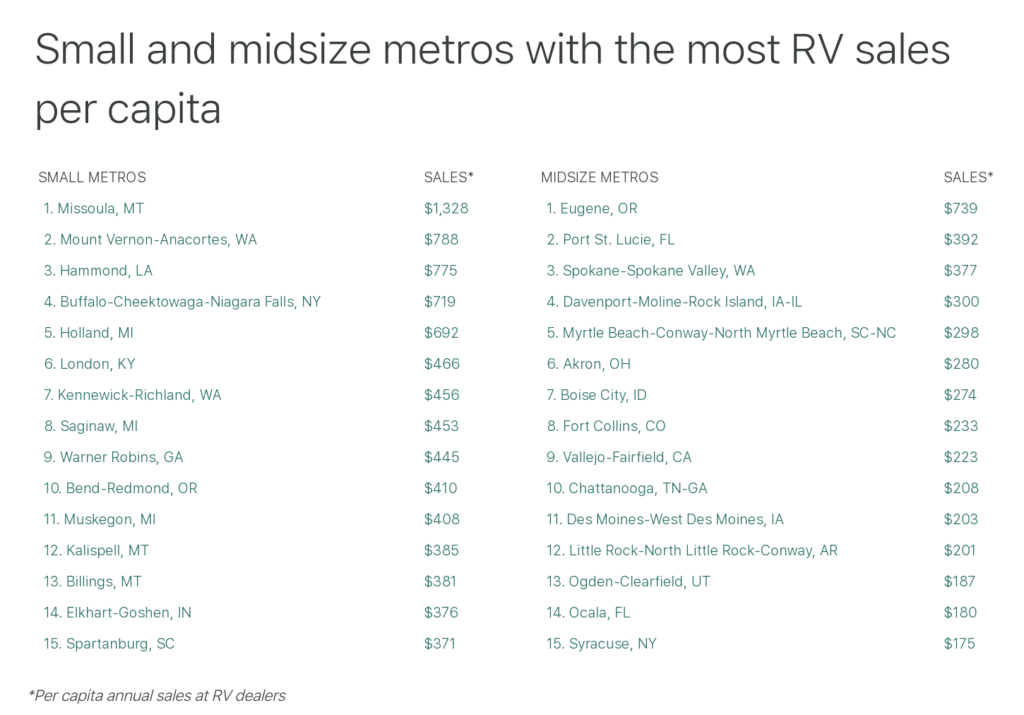
In terms of RV sales at the metro level, locations in Western states that see heavy RV travel are again well-represented. But additionally, many top cities for RV sales are located in Florida. One of the driving factors there may be the state’s high concentration of retirees, who are traditionally one of the strongest segments for the RV industry.
To find the metros with the highest levels of RV spending, researchers at Outdoorsy used data from the U.S. Census Bureau and calculated per capita annual sales at RV dealerships. The researchers also calculated total annual sales at RV dealers for each metro, along with data on the relative density of RV dealers in the area, median income, and metro population for comparison purposes.
Here are the metropolitan areas with the most RV sales per capita.
Large metros with the most RV sales per capita

15. Albany-Schenectady-Troy, NY
- Per capita annual sales at RV dealers: $127
- Annual sales at RV dealers: $111,374,000
- Density of RV dealers (compared to average): +3.6%
- Median household income: $73,398
- Population: 880,381
TRENDING
If you’re looking for an escape into the great outdoors, Great Smoky Mountains National Park might be the perfect place, which is why more visitors visit the Smoky Mountains than any other national park in the U.S.
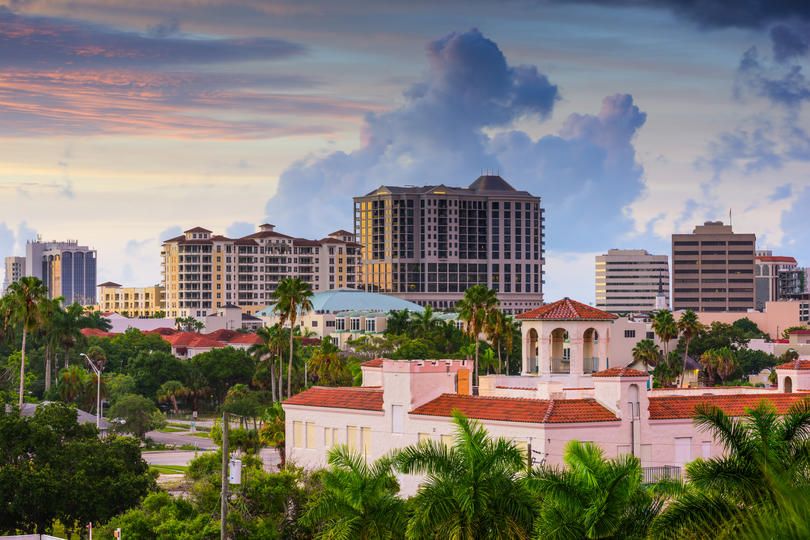
14. North Port-Sarasota-Bradenton, FL
- Per capita annual sales at RV dealers: $129
- Annual sales at RV dealers: $108,316,000
- Density of RV dealers (compared to average): +99.7%
- Median household income: $65,526
- Population: 836,995

13. Orlando-Kissimmee-Sanford, FL
- Per capita annual sales at RV dealers: $144
- Annual sales at RV dealers: $374,513,000
- Density of RV dealers (compared to average): -35.9%
- Median household income: $61,876
- Population: 2,608,147

12. Sacramento–Roseville–Arden-Arcade, CA
- Per capita annual sales at RV dealers: $146
- Annual sales at RV dealers: $345,659,000
- Density of RV dealers (compared to average): +54.3%
- Median household income: $76,706
- Population: 2,363,730
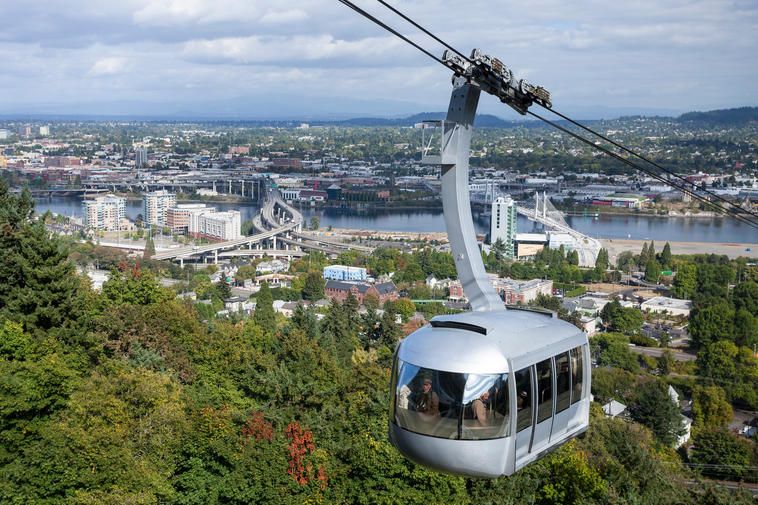
11. Portland-Vancouver-Hillsboro, OR-WA
- Per capita annual sales at RV dealers: $152
- Annual sales at RV dealers: $379,560,000
- Density of RV dealers (compared to average): +52.4%
- Median household income: $78,439
- Population: 2,493,221

10. Oklahoma City, OK
- Per capita annual sales at RV dealers: $153
- Annual sales at RV dealers: $216,145,000
- Density of RV dealers (compared to average): +18.6%
- Median household income: $60,605
- Population: 1,408,950

9. Tulsa, OK
- Per capita annual sales at RV dealers: $154
- Annual sales at RV dealers: $154,280,000
- Density of RV dealers (compared to average): +67.4%
- Median household income: $57,859
- Population: 998,655
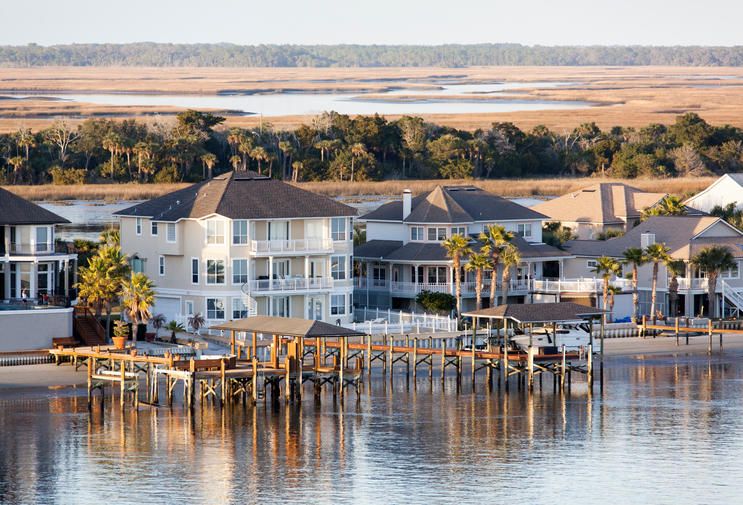
8. Jacksonville, FL
- Per capita annual sales at RV dealers: $160
- Annual sales at RV dealers: $249,257,000
- Density of RV dealers (compared to average): +7.2%
- Median household income: $65,880
- Population: 1,559,514

7. Knoxville, TN
- Per capita annual sales at RV dealers: $186
- Annual sales at RV dealers: $161,989,000
- Density of RV dealers (compared to average): +109.7%
- Median household income: $56,623
- Population: 869,525
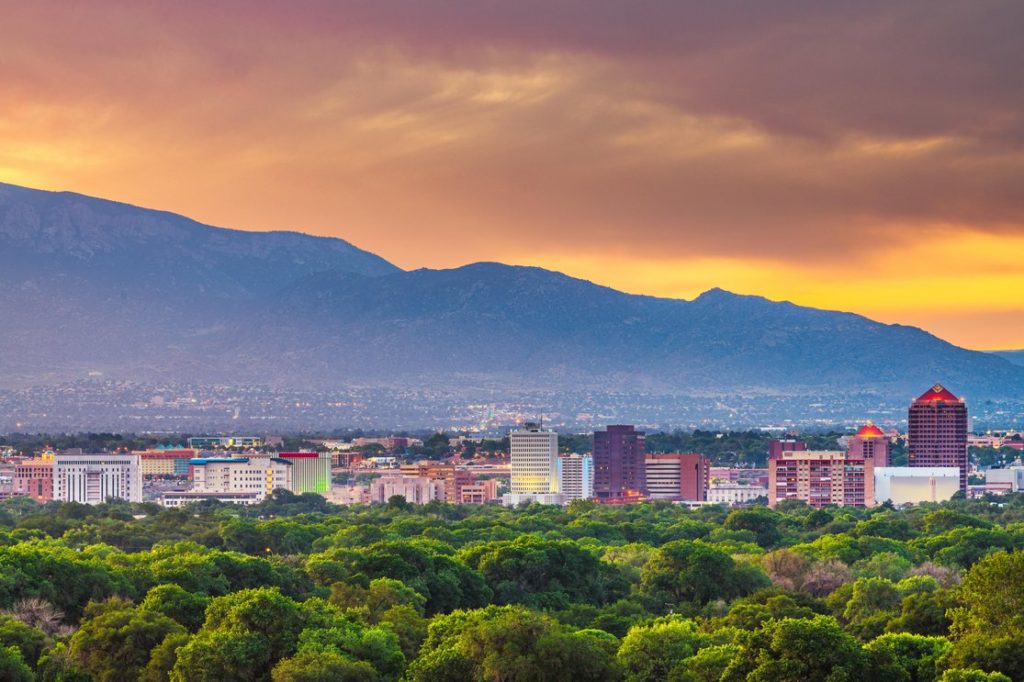
6. Albuquerque, NM
- Per capita annual sales at RV dealers: $199
- Annual sales at RV dealers: $181,655,000
- Density of RV dealers (compared to average): +116.0%
- Median household income: $58,512
- Population: 914,480

5. Tucson, AZ
- Per capita annual sales at RV dealers: $210
- Annual sales at RV dealers: $220,123,000
- Density of RV dealers (compared to average): +88.6%
- Median household income: $56,169
- Population: 1,047,279
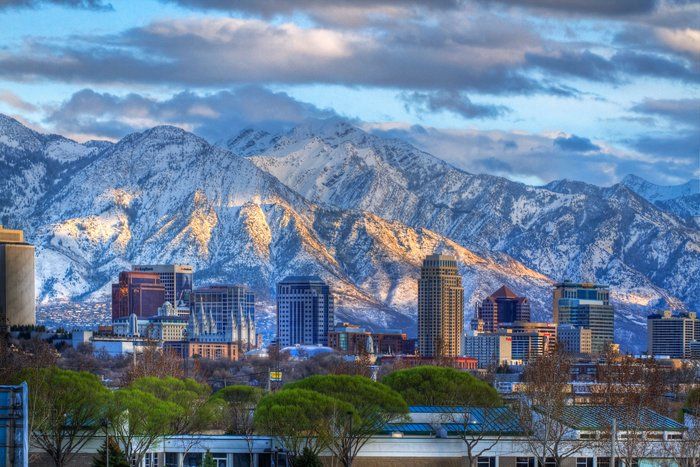
4. Salt Lake City, UT
- Per capita annual sales at RV dealers: $215
- Annual sales at RV dealers: $264,572,000
- Density of RV dealers (compared to average): +35.6%
- Median household income: $80,196
- Population: 1,232,696

3. Grand Rapids-Wyoming, MI
- Per capita annual sales at RV dealers: $253
- Annual sales at RV dealers: $272,869,000
- Density of RV dealers (compared to average): +83.4%
- Median household income: $65,739
- Population: 1,077,370
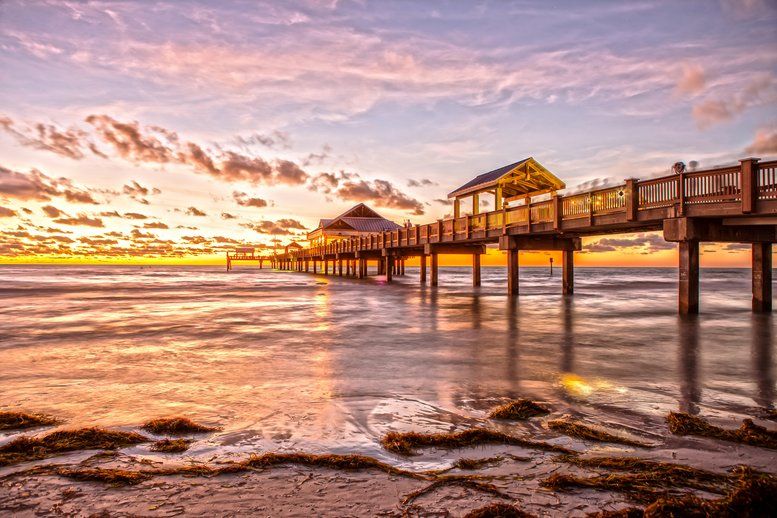
2. Tampa-St. Petersburg-Clearwater, FL
- Per capita annual sales at RV dealers: $256
- Annual sales at RV dealers: $818,394,000
- Density of RV dealers (compared to average): -0.1%
- Median household income: $57,906
- Population: 3,194,831
RELATED
Home to the world’s longest continuous waterfront sidewalk, Tampa is a beautiful place to explore by RV. To get started, check out our guide to RV rentals in Tampa.
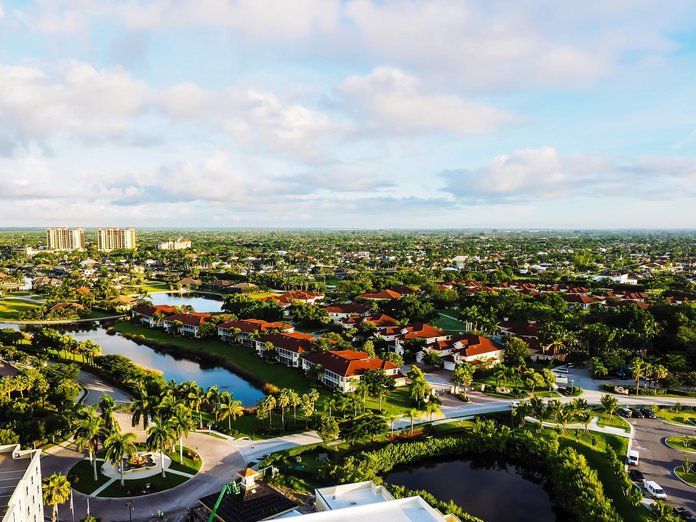
1. Cape Coral-Fort Myers, FL
- Per capita annual sales at RV dealers: $377
- Annual sales at RV dealers: $290,554,000
- Density of RV dealers (compared to average): +116.9%
- Median household income: $62,240
- Population: 770,577
Detailed Findings & Methodology
The data used in this analysis is from the most recent U.S. Census Bureau Economic Census, released in 2020, as well as the RV industry Association. To determine the locations with the most RV spending per capita, researchers calculated annual sales at recreational vehicle dealers per person. In the event of a tie, the location with the greater annual sales at RV dealers was ranked higher. To improve relevance, only metropolitan areas with at least 100,000 residents were included. Additionally, metros were grouped into cohorts based on population size: small (100,000–349,999), midsize (350,000–749,999), and large (750,000 or more).